
The success of a business relies heavily on its ability to analyze and understand its performance. A critical tool that businesses can utilize to achieve this is the stacked chart. Across diverse fields and sectors, businesses need to maintain a holistic view of various factors impacting their operations to make informed, robust decisions that support their progress and growth. In this article, we delve into understanding business performance using stacked charts.
Understanding Stacked Charts
A stacked chart provides a visual illustration of various individual data elements grouped collectively on the same chart, with each segment of the chart representing a segment of the total data being illustrated. These charts can effectively display changes over a given time period for multiple categories simultaneously. This makes them an ideal tool in scenarios where demonstrating both the collective performance and individual contributions of different categories is beneficial.
The concept of stacked charts is not limited to a certain kind or volume of data. They can be employed to track a plethora of subjects, from sales data across multiple product lines and shifts in market share among competitors over time to the distribution of a company’s workforce among different departments. Whether the focus is on a smaller dataset with only a few categories or larger datasets with multiple categories, the flexibility of stacked charts can simplify analysis and decision-making processes.
Relevance of Stacked Charts in Business

Businesses today deal with broad and multifaceted data. Making sense of this data and turning it into actionable insight is where stacked charts come in. By offering a visual representation, stacked charts allow businesses to efficiently analyze large chunks of data. It simplifies the process of reading the data, illuminating relationships, and identifying trends and patterns that could have potential impacts on the business.
Stacked charts are unique in their ability to represent multiple data series. They enable businesses to represent different categories of information in the same space, which is critical in situations where individual departmental results must be considered against the overall company performance. Tracking different metrics simultaneously can help businesses identify correlations, trends, and causal relationships among multiple variables, leading to a highly informed, data-driven decision-making process.
Categories of Stacked Charts
Fundamentally, stacked charts are divided into two classes: regular stacked charts and 100% stacked charts. Visualizing sections of wholes, the regular stacked chart type is often used for showing accumulated totals over time or space. They outline the overall trends as well as provide information about individual categories. They are a prime tool for segment comparison, as they allow areas of the smallest segments to be compared to the total area at a glance.
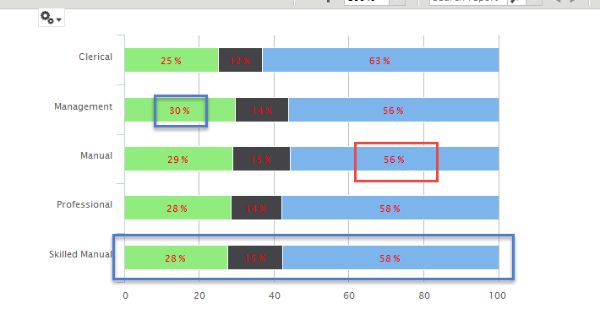
Contrarily, the 100% stacked charts show the relative proportions of multiple categories, making it easier to compare different categories and the overall composition of data. Instead of focusing on the exact data values, 100% stacked charts bring attention to the percentage distributions. This type of stacked chart is particularly beneficial for understanding the percentage that each category contributes to the whole, hence ensuring a focus on the part-to-whole relationship.
Both categories present the information in a compact and user-friendly form, making them invaluable tools for business analysis. Businesses can customize the chart type based on the nature of the data they are dealing with and the analytical objective they aim to achieve.
Overall, stacked charts stand as valuable data visualization tools for businesses to understand and analyze their performance across various dimensions simultaneously. They provide a means to visualize, track, and understand the collective as well as individual contributions of different variables to a total.
Altogether, the proper application of stacked charts can lead to enhanced decision-making abilities and improved business performance. However, users must be aware of potential pitfalls and ensure a balanced and accurate representation for optimal use of this visual aid.